Project details
Academic
Year : 2018
University: TU Delft
Categories : Interaction Design, Industrial Design
Design Team :
Alara Bozbay
Eveline Beukers
Maurits van Rossum
Noor Smit
Taresh Ghei
Yu Wang
How can we reduce anxiety and reassure people who measure their blood pressure at home using the Microlife Blood pressure monitor?
Hypertension is one of the main risk factors for a stroke and can occur to anyone.
Several institutions and organizations recommend monitoring blood pressure at home, especially those with high blood pressure. Home monitoring can help to monitor blood pressure in a familiar setting, allows for an early diagnosis and alert both you and your doctor to potential health complications.
The Microlife BP A6 BT is a blood pressure monitor intended for home use and monitoring. However, during our research, several issues were found with the usability of the product and the companion app. leading to people feeling very anxious with their results. Hence, the goal of the project was to come up with a redesign for its user interface and product experience in order to reduce the anxiety and stress felt by people.
THE MICROLIFE BP A6 BT
Bluetooth® blood pressure monitor with stroke risk detection
Equipped with stroke risk detection and Bluetooth.
Automated measurement process, suitable for home use.
Can detect atrial fibrillation and hypertension.
Can memorise up to 99 measurements
Can be connected to your PC or to an App - the Microlife@home application, developed by the Netherlands based company Medicine Men.
THE REDESIGN
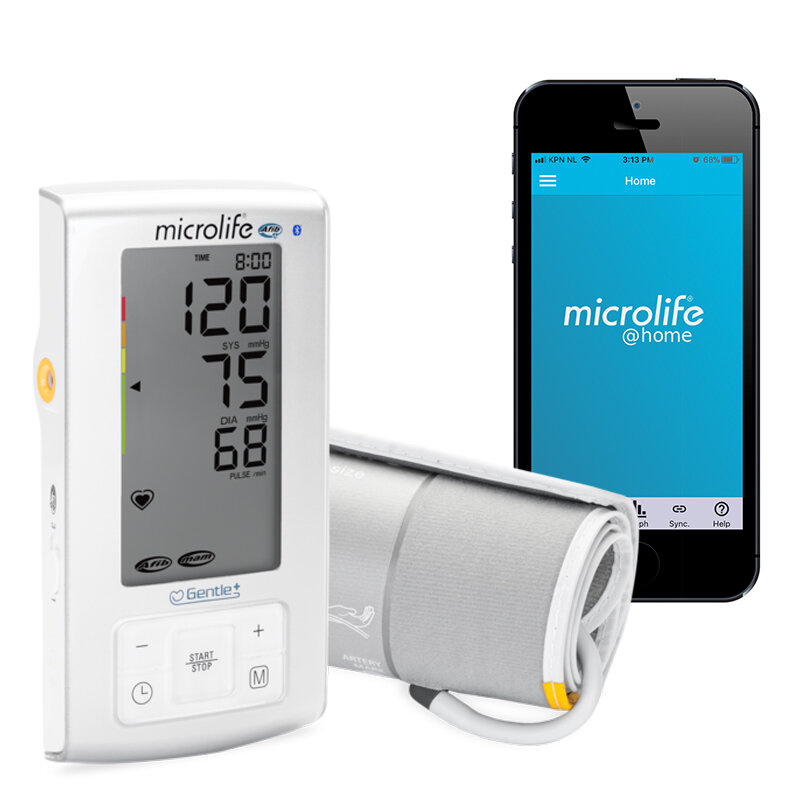
ORIGINAL DEVICE & APP
The original device showed several usability problems and did not inspire confidence in the users. Similarly, there were several usability and interface issues within the companion app which had to be redesigned.
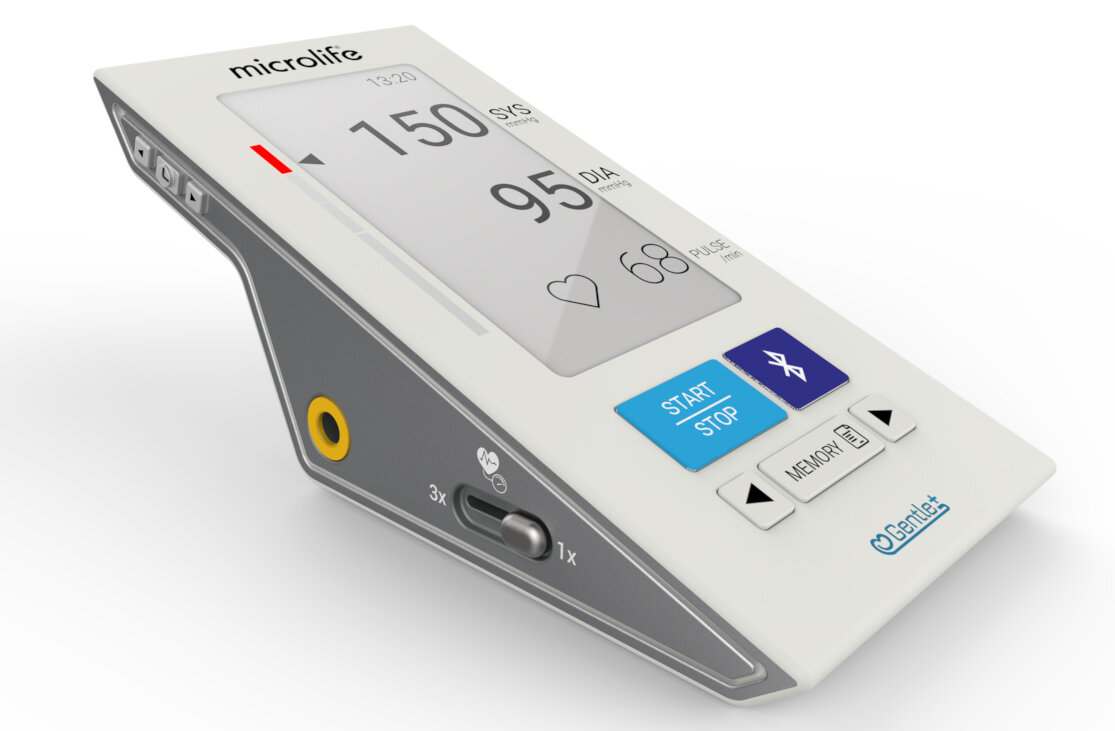
NEW REDESIGNED DEVICE & APP
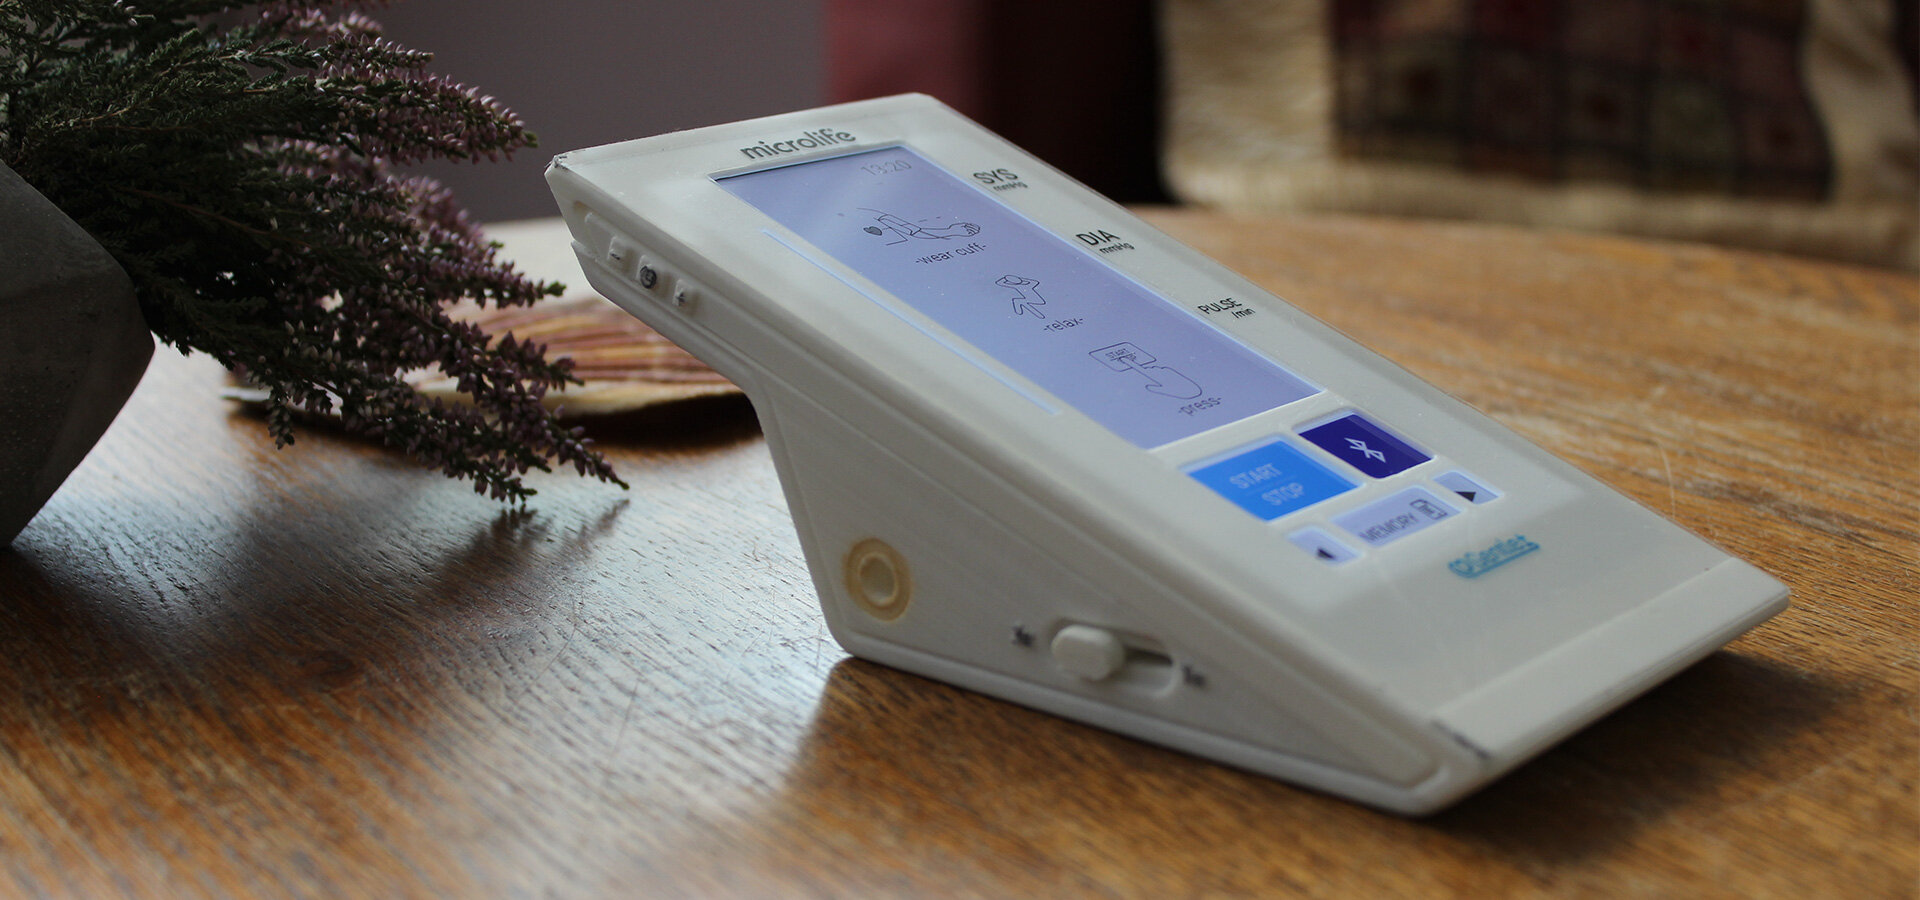
The new device features a more streamlined, clinical look with a tilted screen for ergonomic viewing, improved product interface as well as a completely redesigned companion app.
RESEARCH & ANALYSIS
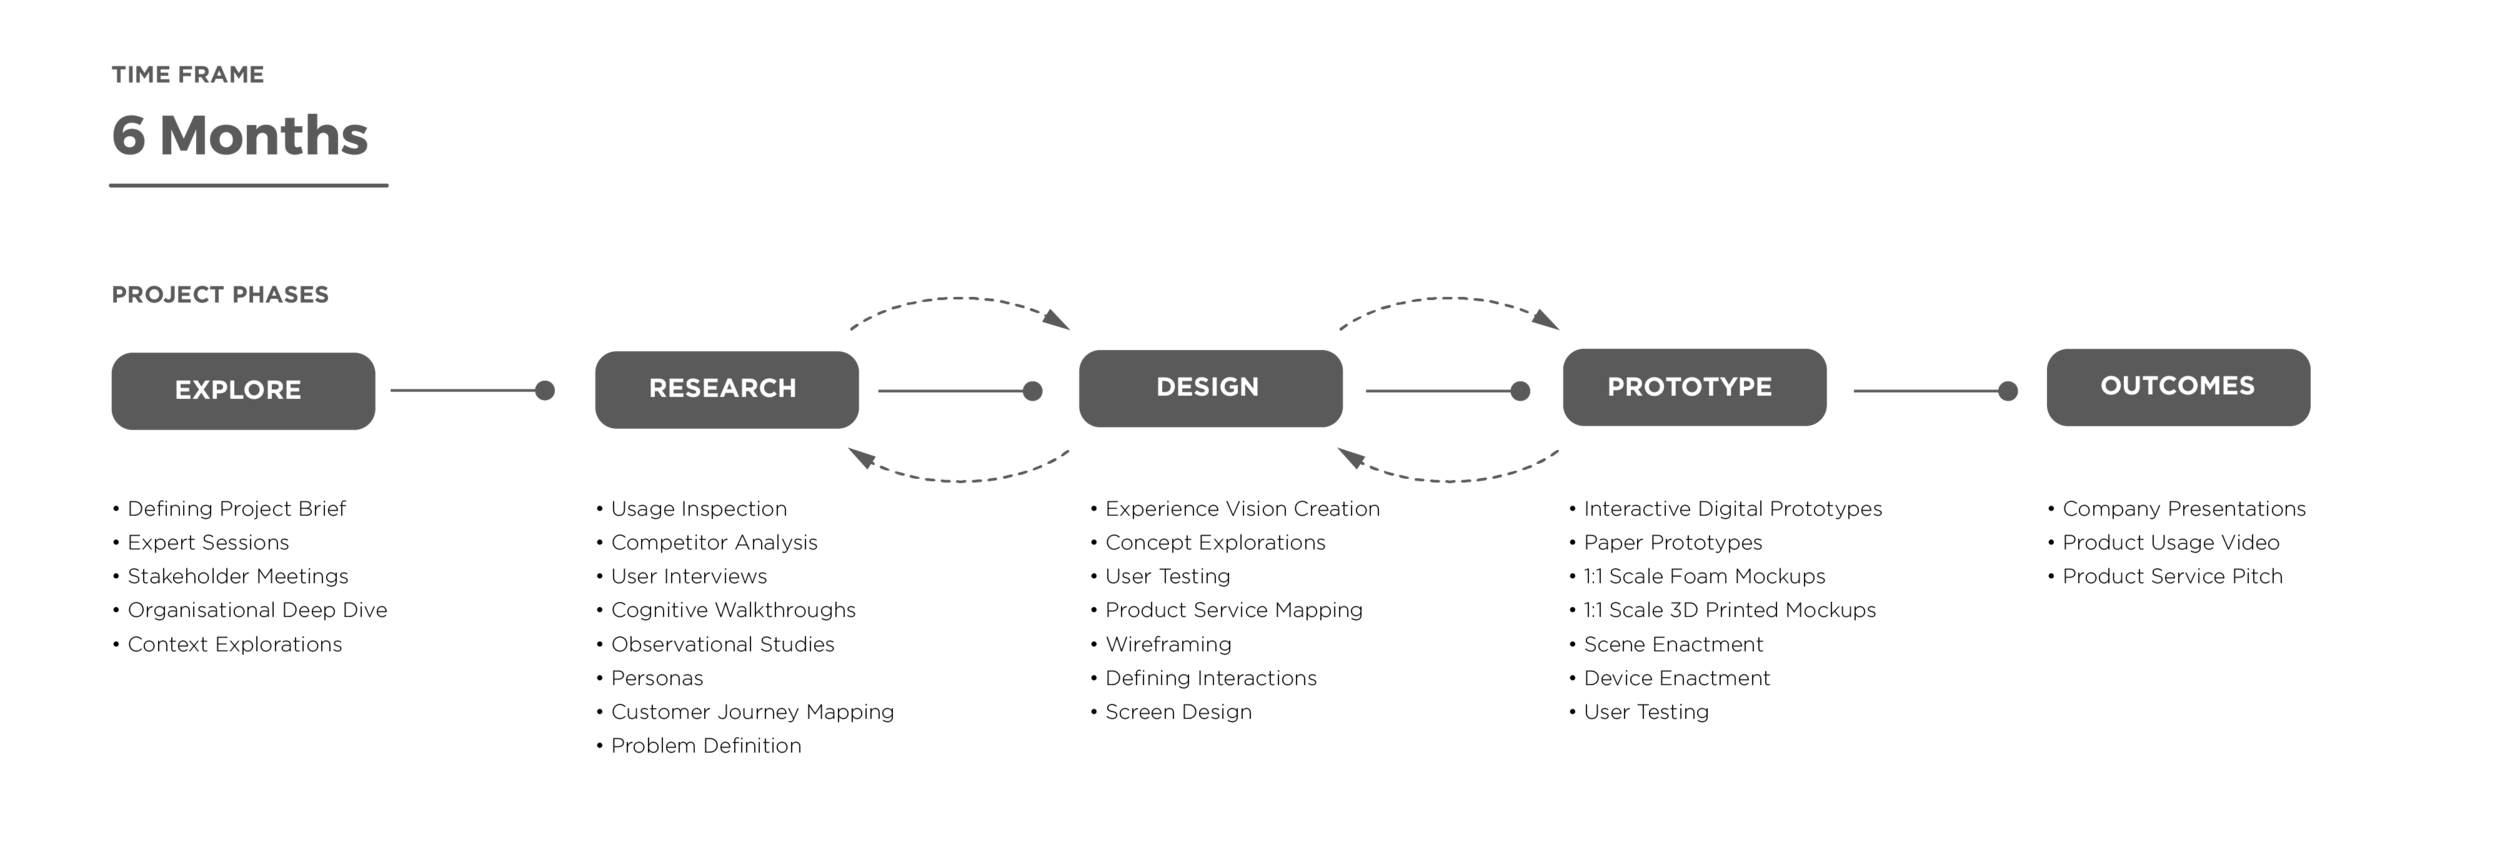
The research phase involved conducting user tests, cognitive walk through as well interacting with multiple GP’s to get a detailed understanding of the product as well as the connected app. Through this phase, several pain points were identified.
PAIN POINTS
Button comprehensibility
The buttons and their functions are not comprehensible for the first time user.
Synchronizing with the app
The synchronisation with the app takes a lot of time. There is no easy way to see if the devices connect to one another.
Feedback during and after measurement
None to a little feedback of the device around the time of the measurement. Users do not know what is wrong when the device gives an error.
Understanding the data
The understanding of the data is currently supported by the colored bar at the right of the screen. The text on the display explaining the measurement data is too small to read for the eyes of the elderly.
Stability and ergonomics
The device on the stand is not stable and easily knocked over. The device itself is a little tilted, but reading the display is difficult.
DESIGN GOAL
To redesign the Microlife Blood pressure monitor and connected App in order to make the user feel reassured and confident before, during and after measuring their blood pressure and sharing the data with their GP, by providing clear guidance and feedback.
USER PERSONAS
DESIGN EXPLORATIONS
MINIMALIST
OBVIOUS
INNOVATIVE
PROTOTYPING & TESTING
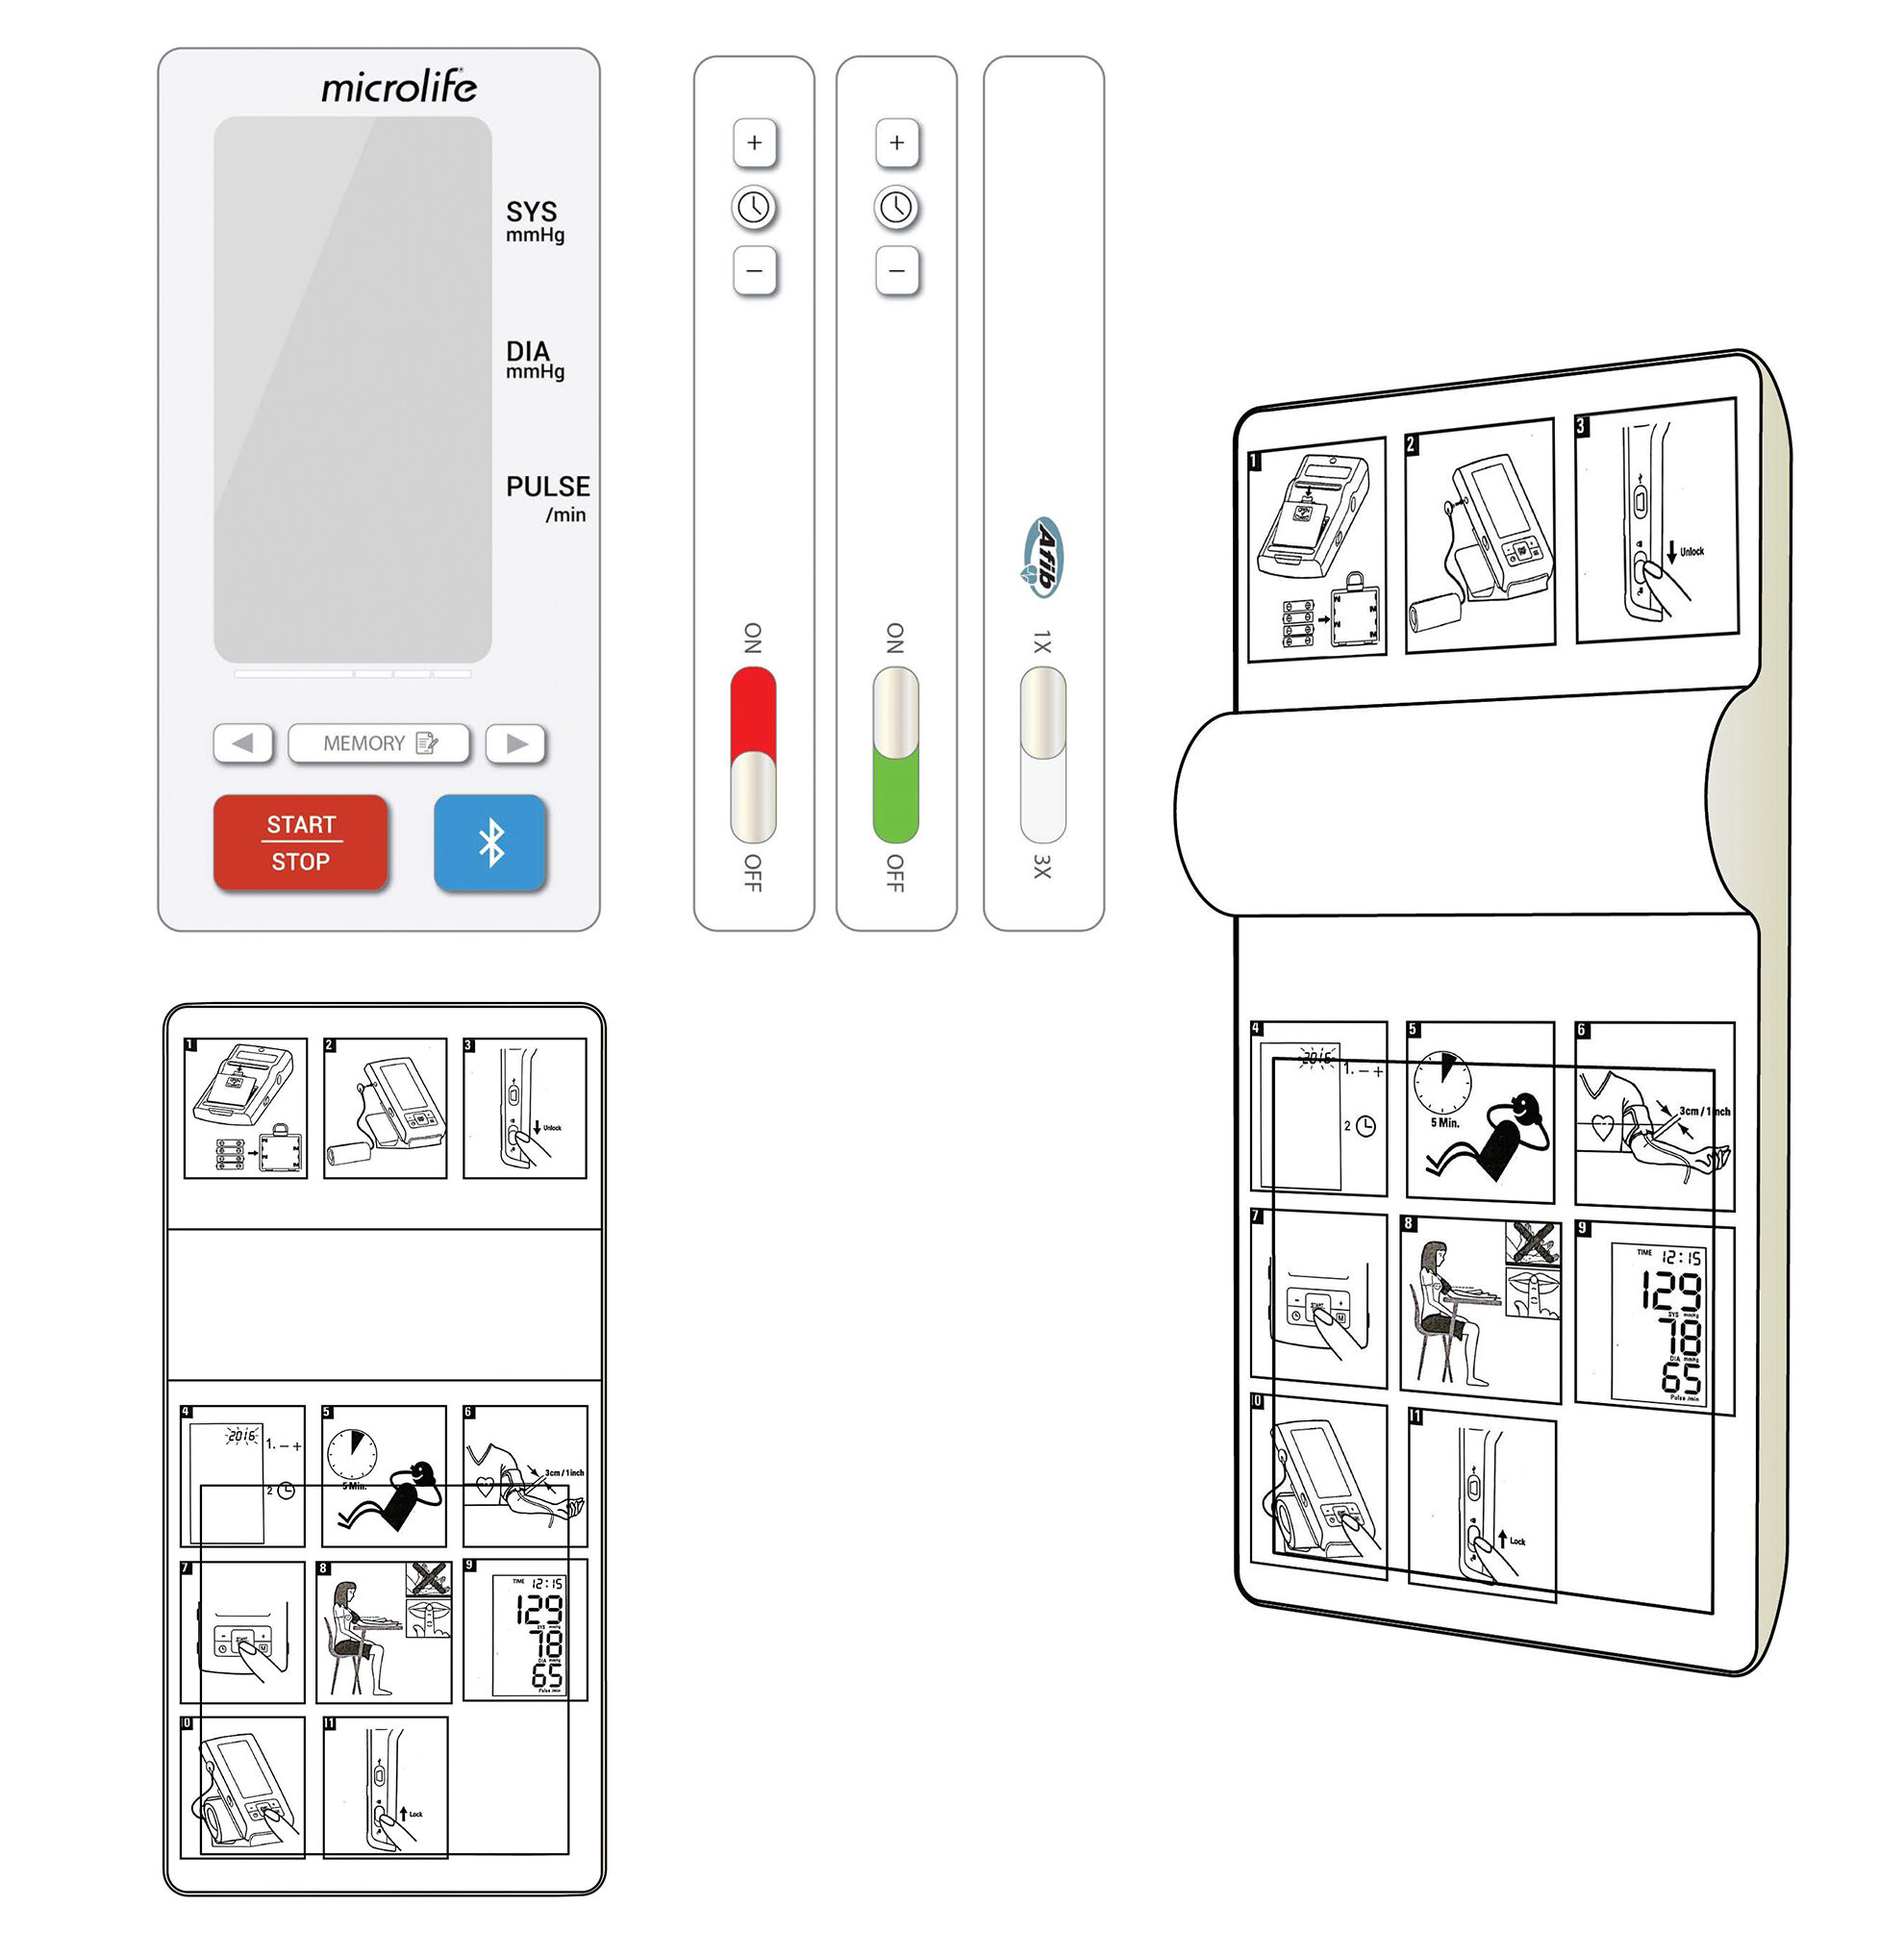
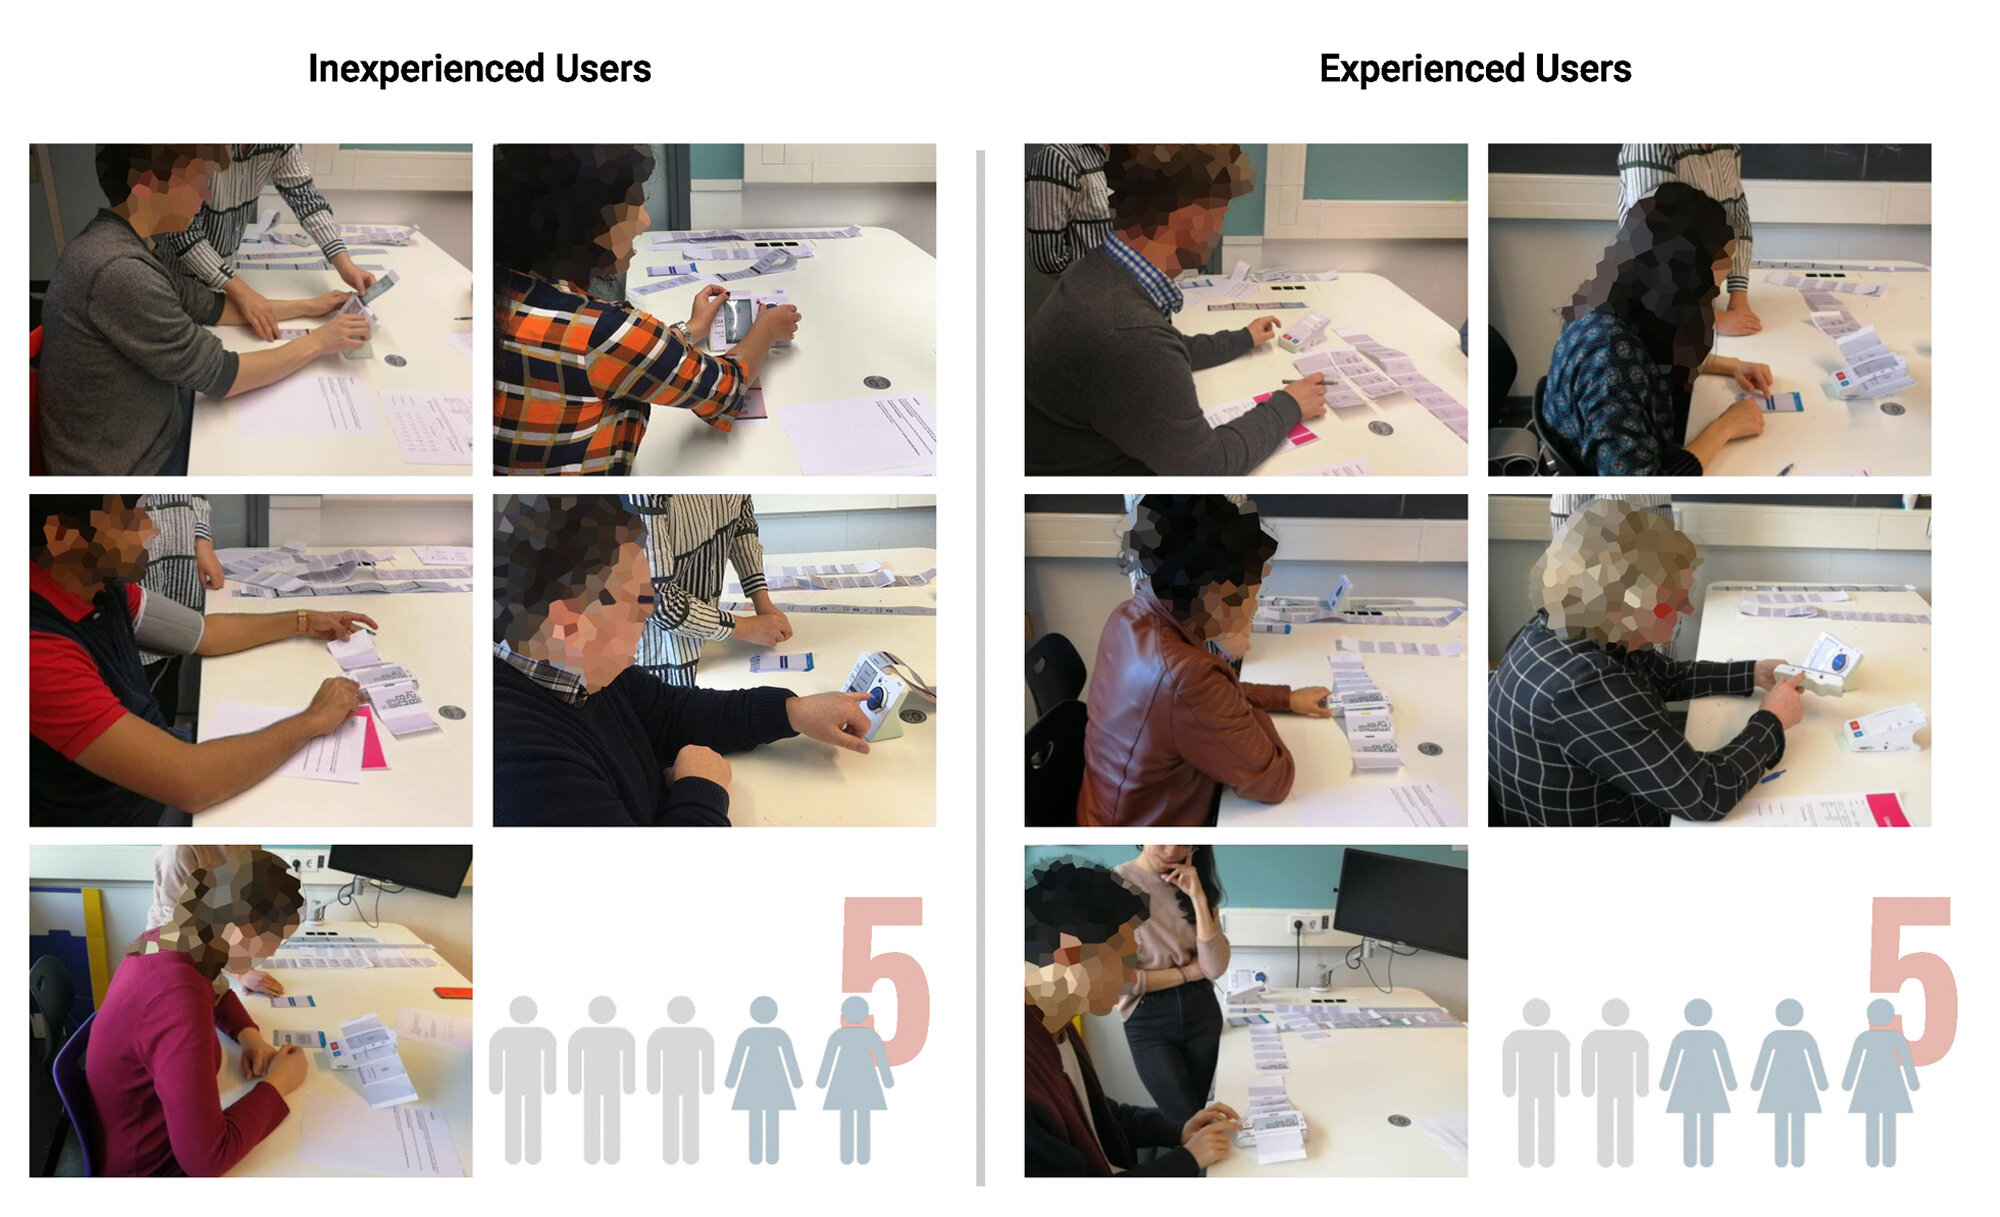
Foam mockups were created based on each concept direction. In order to simulate the usage experience, paper templates were glued onto the foam mockups. Buttons were simulated by making them out of cardboard. The user interface task flow was done using paper prototyping integrated with each concept.
Finally, each of these 3 concepts were tested with two different sets of participants - Inexperienced users and experienced users.
USER TESTS
The goal of the user tests is to compare the three concepts on the ease of use, the comprehensibility of the feedback and the confidence of the user to operate it without a manual.
THE APP
The Microlife@home App was redesigned to make it easier for patients to review their data and measurements, to connect their device as well as send their data remotely to their GP.
PROTOTYPING & TESTING
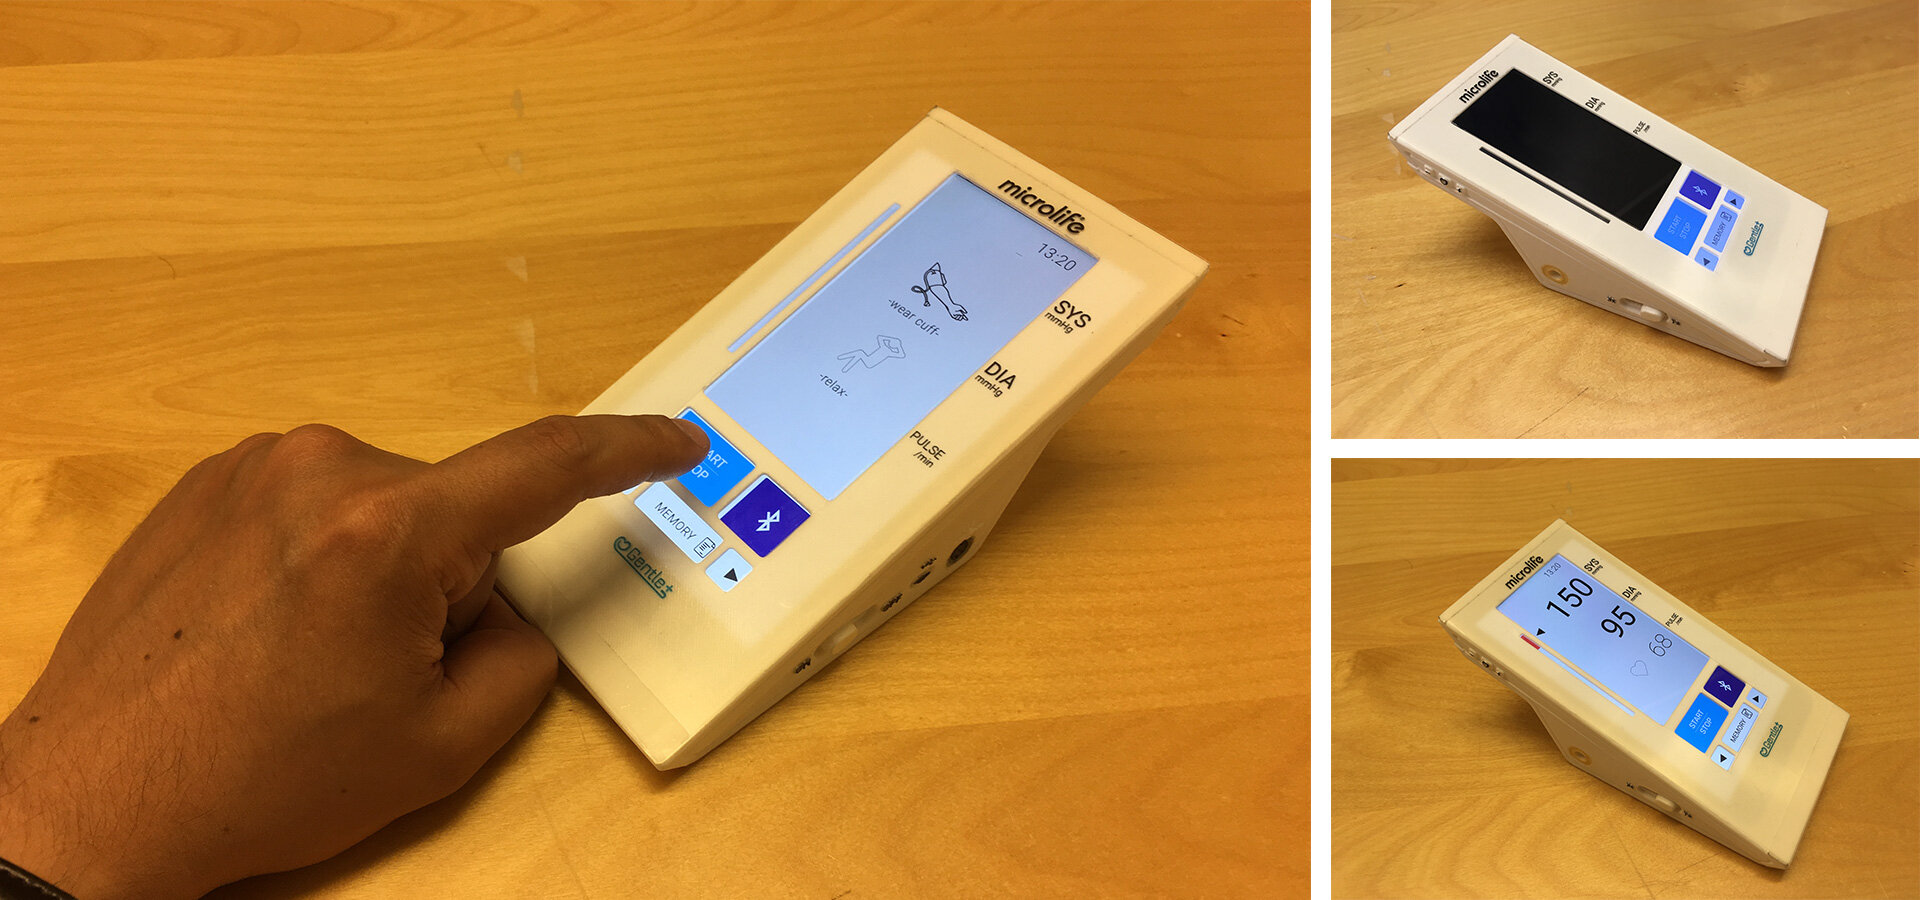
A final user test was conducted with 9 participants with the newly redesigned device and the connected app. The goal of this final test was to see if participants understood the functions of all the buttons, is the user interface intuitive enough for a better experience, are they able to interpret the data and if they trust the results.
FEEDBACK & RESULTS
The results were very positive. Participants remarked on the easy to understand, step by step instructions and user interface of both the device as well as the app. In addition, participants liked the inclined casing design of the device.
‘’The device looks clinical which makes it trustworthy.’’
‘’The sound feedback is reassuring.’’
“I really like the overview of the measurements and the nice inviting graph for presenting the data.”
“I was afraid of the Bluetooth part, but I am surprised about how easy it went.”
